Section outline
-
Holt Math-Ables Activity (Create Bar Graphs) Pg.288
Background Colour
Font Face
Font Kerning
Font Size
Image Visibility
Letter Spacing
Line Height
Link Highlight
Text Colour
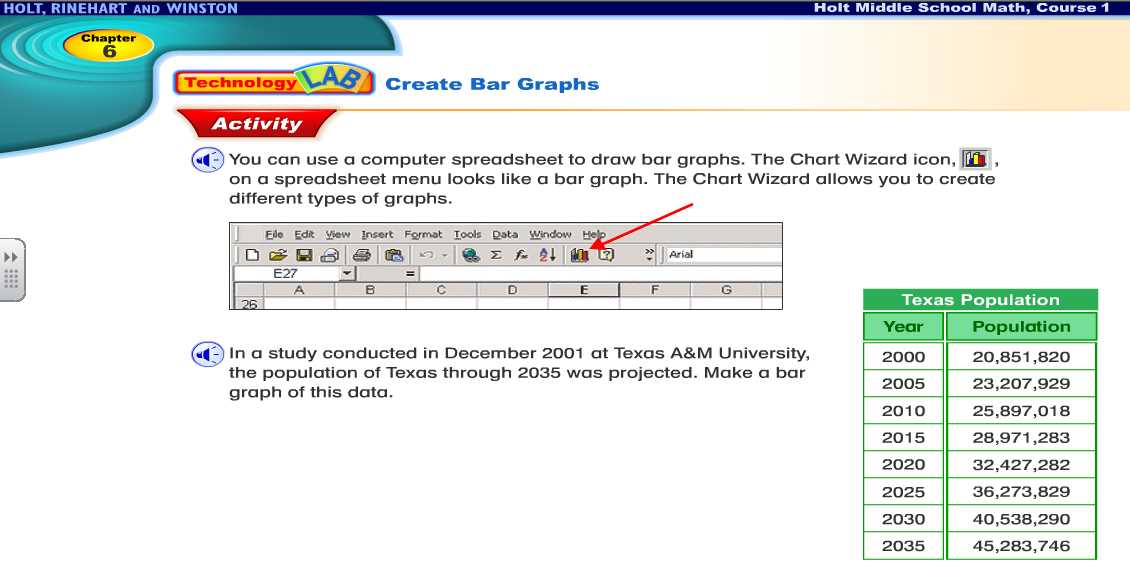
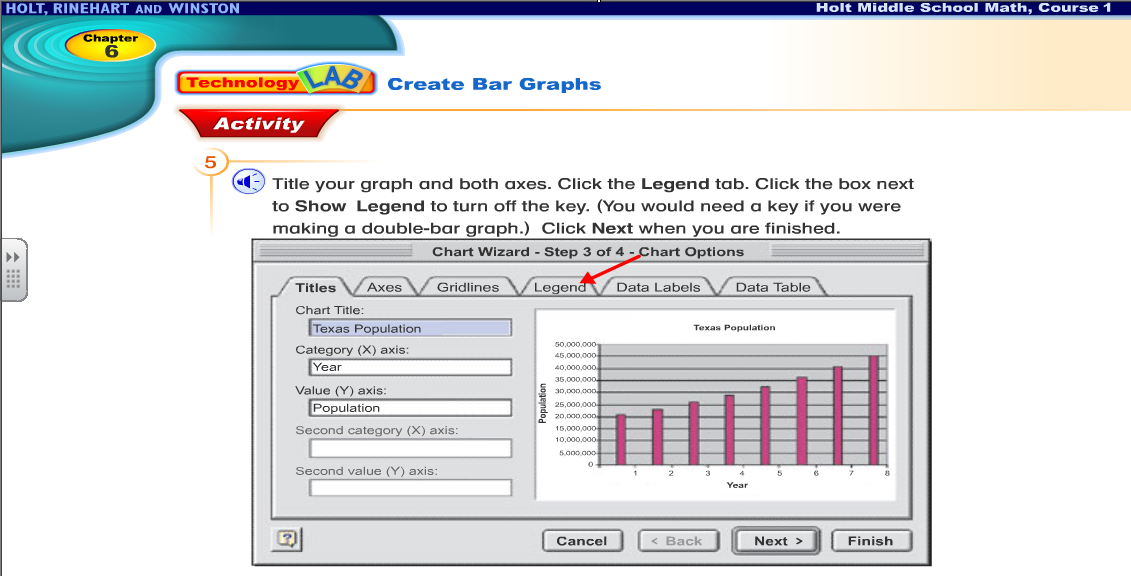
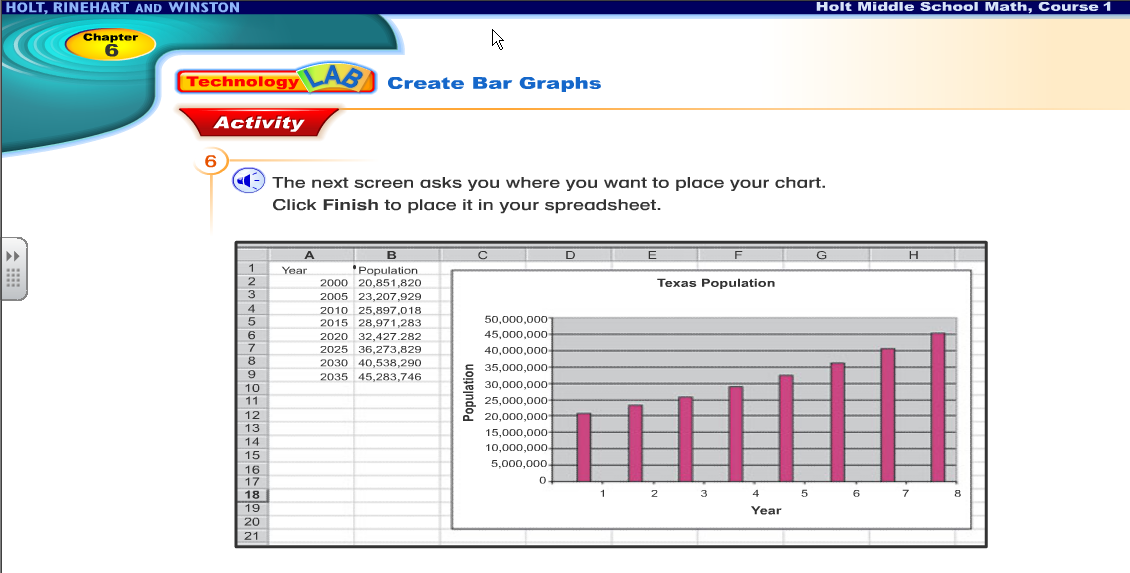
 This Moodle Activity will help you create a computer spreadsheet to draw bar graphs. The Chart Wizard icon on the Excel spreadsheet menu looks like a bar graph. The Chart Wizard allows you to create types of graphs.
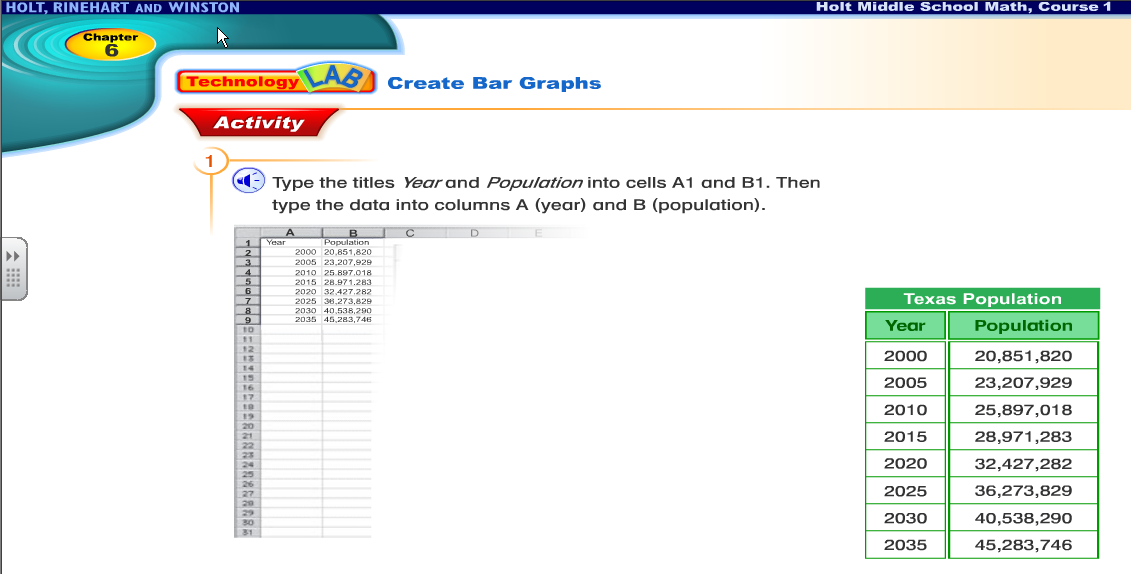
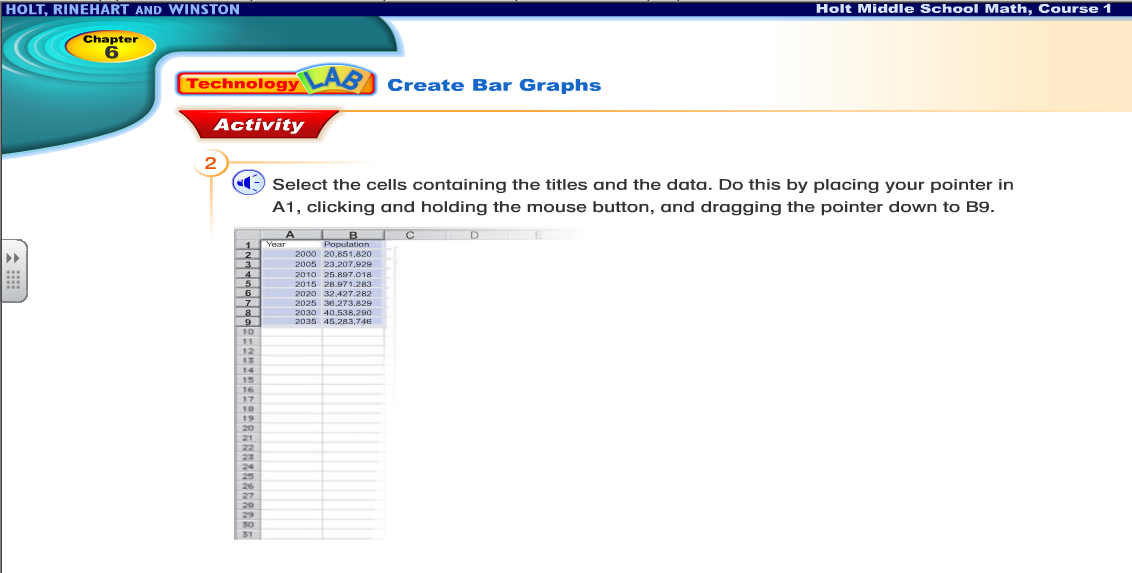
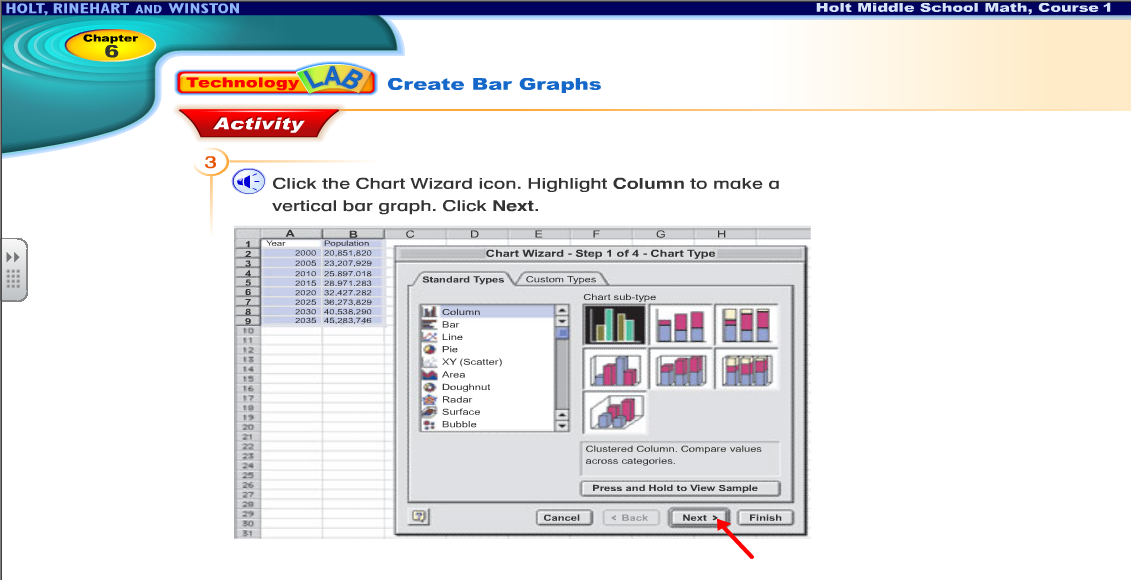
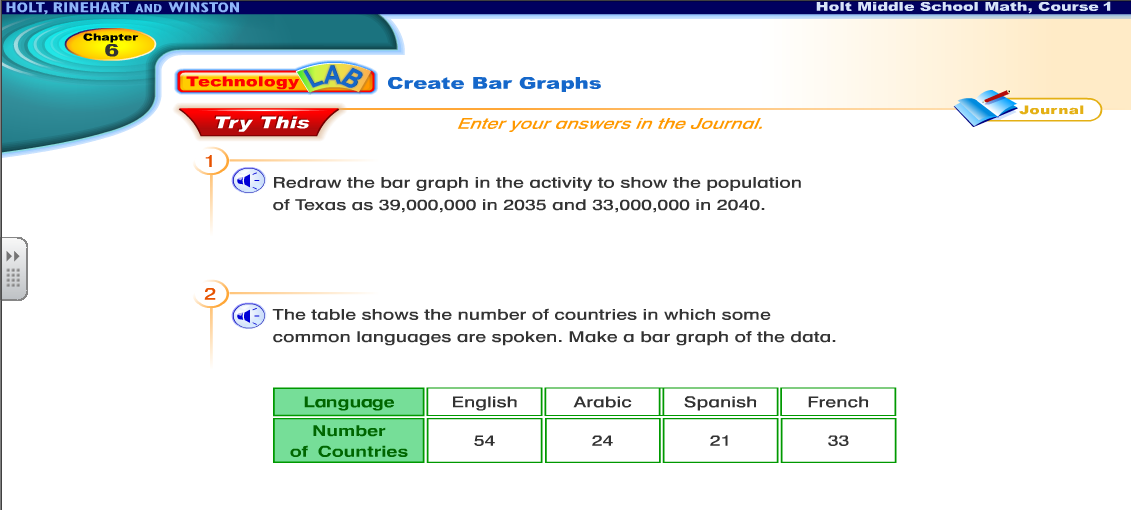
  Pull up a blank Microsoft Excel Document and follow the directions below. Read each set of directions and create your own bar graph. Print your final bar graph for Mr. Kaschak.
  Press the link below and follow the instructions OR continue reading through the directions below.